
Voice Analyzer
Updated Apr 21, 2026 · v2.0


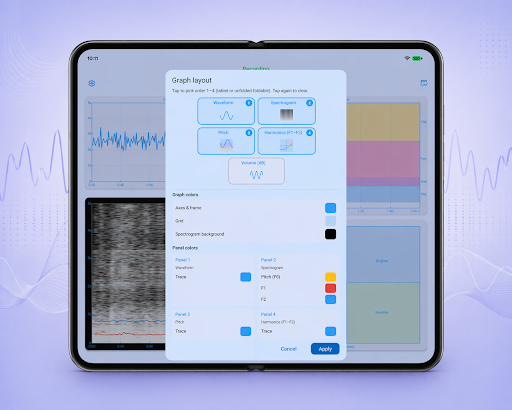
Spectrogram and waveform voice analyzer demo
Visualize sound in real time with this lightweight demo application. It includes: - Spectrogram view: Displays frequency over time, representing intensity with color. - Waveform view: Shows sound amplitude in real time. - Charts: Full axis frame, shared layout between views, and clear axis labels. - Large screens: More time detail on tablets and foldables; spectrogram stays smooth when scaled up. - System UI: Edge-to-edge with safe padding for notches and the nav bar; status bar matches the app background. - Tabletop mode: Half-open foldables and flips use a 50/50 split at the hinge, no resize drag, and status text hidden so graphs line up with each half. - Graph layout: Choose up to four panels (phone or wide layout), tune axes, grid, and spectrogram letterbox, and set panel colors (traces, spectrogram tracks, pitch Hz-band fills, and harmonics quadrants). - App theme: Blue or Material You (Android 12+); theme dialog uses the same filled Apply button style as graph settings.
1 year on Google Play
This app isn't currently appearing in any tracked top charts.