
Evaluator and Grapher
Updated Jan 28, 2022 · v1.1

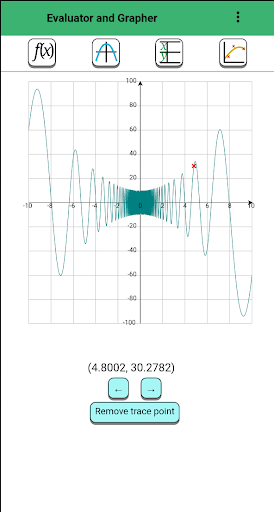


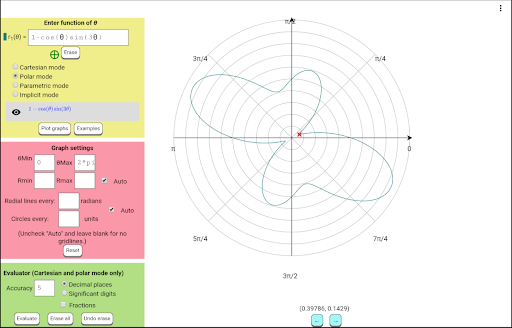


Grapher for explicit, implicit, polar, and parametric curves.
This completely free app with no ads has an intuitive interface reminiscent of graphing calculators. It draws curves in four modes: Cartesian Mode, showing the graphs of functions f(x) you specify, Polar Mode, showing a circular polar grid and graphs of polar curves r(theta), Implicit mode for graphing equations in x and y, and Parametric Mode for curves of the form (x(t), y(t)). Easy-to-specify graph settings for viewing important parts of graphs with the same "auto fit" feature you find in graphing calculators, so you need specify only the domain xMin, xMax (if you like) to see a part of a curve you are interested in. Zooming in for a closeup of any part of the plane to see small details clearly is easy with an intuitive and easy-to-control "zoom box." In addition to the "trace" feature you may be used to from graphing calculators, there is also a Table of values feature that allows to to evaluate all the functions in your list for Cartesian and Polar mode at whatever values of the independent variable you specify. The "Points and Curve Fit" window can be used to add plotted sets of points to your graph and also find a best-fit curve of any type you specify to model a data set, also showing you r-squared and p-values for the fit.
4 years on Google Play
This app isn't currently appearing in any tracked top charts.